
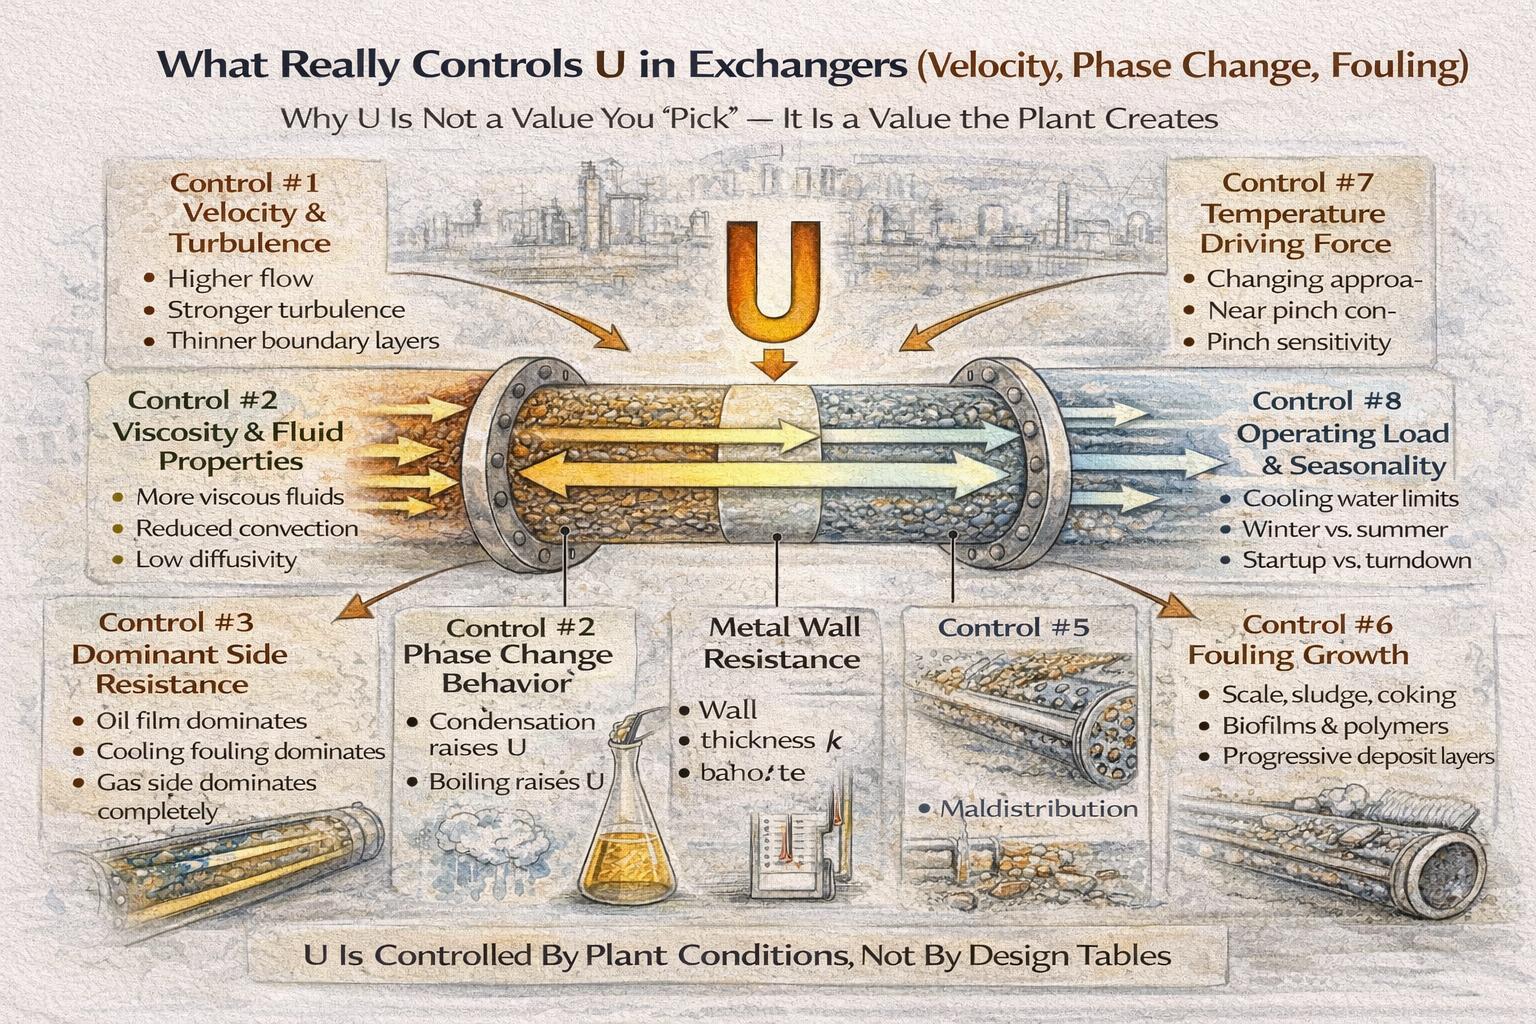
The overall heat transfer coefficient U is often treated as if it comes from a table.
In design offices, it is common to hear:
- “Assume U = 300.”
- “This service should give a good U.”
- “Increase U and duty will improve.”
But real exchangers do not behave according to assumed numbers.
In real plants, U is controlled by a combination of factors that interact continuously:
- velocity and turbulence
- fluid properties and viscosity
- phase change behavior
- fouling growth over time
- maldistribution inside equipment
- operating load and seasonality
This article explains what truly controls U, why it changes so much, and why chasing U without understanding its drivers leads to repeated exchanger problems.
Table of Contents
Control #1: Fluid Velocity and Turbulence
The most powerful operational driver of U is velocity.
Heat transfer coefficients on each side depend strongly on turbulence.
Why turbulence matters
Near the wall, fluids form a boundary layer.
- In laminar flow, this layer is thick → resistance is high
- In turbulent flow, the layer is thin → resistance is low
So higher velocity usually increases turbulence, and turbulence usually increases U.
Plant reality
When plants operate below design load:
- flow drops
- turbulence weakens
- film resistance increases
- U falls sharply
This is why many exchangers perform worse at turndown than at full load.
But higher velocity is not always the solution
Increasing velocity may cause:
- excessive pressure drop
- tube vibration
- erosion
- accelerated fouling in some services
So velocity is a strong lever, but not a free one.
Control #2: Viscosity and Fluid Properties
U is not controlled only by flow rate.
It is also controlled by how the fluid behaves.
Viscous fluids resist convection.
Examples include:
- crude oil
- heavy hydrocarbons
- polymeric liquids
- syrups and resins
At low temperatures, viscosity increases sharply.
So exchangers heating viscous fluids often show:
- poor U at inlet
- better U near outlet
- uneven thermal performance
Key plant insight
A single “average U” hides large internal variation because fluid properties change with temperature.
Control #3: Which Side Dominates the Resistance
U is controlled by the largest resistance in the chain.
In some exchangers:
- hot-side oil film dominates
In others: - cold-side cooling water fouling dominates
In gas exchangers: - gas-side coefficient dominates completely
This explains why:
- improving one side may do nothing
- cleaning the wrong side gives little recovery
- adding area helps more than chasing coefficients
Understanding “which side controls” is more important than calculating U precisely.
Control #4: Phase Change Behavior
Phase change services often produce very high heat transfer coefficients.
Condensation
When steam condenses:
- temperature stays nearly constant
- latent heat transfer is large
- film coefficients are high
Condensers can show very high U compared to liquid-liquid exchangers.
Boiling
Boiling can also increase U — but only under stable regimes.
At high heat flux:
- vapor blanketing
- dry-out
- unstable boiling zones
can reduce effective heat transfer.
Practical takeaway
Phase change does not guarantee high U.
It produces high U only when hydrodynamics remain stable.
Control #5: Fouling — The Long-Term Controller of U
Fouling is the most persistent real-world controller of U.
Even if an exchanger has excellent clean performance:
- deposits add resistance
- U declines gradually
- driving force margin shrinks
Fouling is inevitable in most process services:
- scaling
- sludge deposition
- polymer films
- biological growth
- corrosion product redeposition
Plant reality
Exchangers do not operate at clean U.
They operate somewhere between:
- “less fouled” after cleaning
and - “highly fouled” before shutdown
So U in plants is a moving target.
Control #6: Maldistribution and Bypassing
Design assumes uniform flow distribution.
Real exchangers rarely deliver it.
Inside shell-and-tube exchangers:
- some tubes carry more flow
- some areas stagnate
- bypassing occurs near shell walls
- baffles leak
This creates:
- unused surface area
- localized fouling hot spots
- early pinch behavior
So the exchanger may have plenty of installed area, but only part of it is thermally active.
This is why:
- calculated U looks fine
- real performance remains poor
Control #7: Temperature Driving Force Interaction
U is often treated separately from driving force.
In reality, they interact.
As fouling develops:
- U drops
- more ΔT is required
- approach temperatures tighten
- pinch conditions appear
Near pinch, even small U degradation causes large duty loss.
So exchangers close to tight temperature approaches are extremely sensitive.
Robust exchangers are designed with driving force margin, not just U assumptions.
Control #8: Operating Load and Seasonal Conditions
U values measured in winter often differ from summer.
Why?
- cooling water temperature changes
- viscosity changes
- throughput changes
- utilities become constrained
So the same exchanger behaves differently across seasons.
This is why:
- summer is when exchangers “fail”
- winter hides thermal weakness
Plants that design only for nominal conditions often struggle at extremes.
Control #9: Aging, Surface Roughness, and Repeated Cleaning
Over years, exchanger surfaces change:
- corrosion roughens metal
- repeated cleaning damages oxide layers
- deposits become harder to remove
- baseline U declines permanently
Exchangers do not return to original “clean” condition after many cycles.
So U degradation is not only fouling.
It is lifecycle aging.
Why U Cannot Be Guaranteed
All these controls mean one thing:
U cannot be specified as a constant.
U emerges from:
- fluid behavior
- turbulence
- fouling history
- operating mode
- geometry imperfections
- time
So U is always a plant outcome, not a design promise.
Owner Perspective: What Controls U Controls Money
Owners feel U degradation as:
- rising steam consumption
- higher cooling water demand
- frequent cleaning outages
- throughput limitation
- unstable operation
Understanding what controls U helps plants spend money correctly:
- improving distribution rather than chasing velocity
- adding area rather than forcing turbulence
- optimizing cleaning rather than over-cleaning
U control is not academic.
It is economic.
Final Perspective
U is not controlled by one knob.
It is controlled by an interacting system of:
- velocity
- viscosity
- phase behavior
- fouling
- distribution
- operating history
Engineers who understand these controls stop asking:
- “What is the correct U value?”
And start asking:
- “What is controlling U in this exchanger right now?”
That shift is the difference between textbook heat transfer and plant heat transfer.

A practicing chemical engineer with 17+ years of experience in process design, project execution, commissioning, and plant operations. Focused on practical engineering judgment beyond textbook explanations.